txray
Static analysis that finds slow work hidden inside database transactions, plus a runtime guard and a live terminal monitor for what static analysis cannot see.
A transaction holds a connection and every row lock it has taken until it commits. Anything slow that happens in between (an HTTP request, a Stripe call, an SMTP delivery, a subprocess, a loop over a collection) extends that hold, and every writer queued behind those locks waits with it. The worst cases are the ones nobody wrote on purpose: an after_create callback three method calls away from a payment API.
txray parses your application with Prism and follows callbacks, concerns, service objects and helper methods to find that work. It never boots your app and never runs your code, so it reports problems on paths your test suite has never executed.
app/models/order.rb
  13:5  high   external-service-in-transaction
    External service call `Stripe::PaymentIntent.create(amount: total_cents)` runs inside the `after_create :settle` callback
      via Order#charge_card (app/models/order.rb:12)
    Third party clients hold the connection and the row locks for their full round trip. Call them after commit.
Install
For the scanner alone:
group :development, :test do
  gem "txray", require: false
end
For the scanner and the runtime guard and live monitor, drop require: false, or the railtie never loads and the guard silently never installs:
group :development, :test do
  gem "txray"
end
Then:
bundle exec txray
It exits non zero when it finds something, so it drops straight into CI. No configuration is required; everything below has a default.
In a Rails app, bin/rails generate txray:install writes a commented .txray.yml and prints the next steps. Outside Rails, bundle exec txray --init writes the same file.
What counts as a transaction
txray does not only look for transaction do:
| Scope | Example |
|---|---|
| Explicit blocks | Order.transaction { ... }, ActiveRecord::Base.transaction { ... } |
| Row and advisory locks | order.with_lock { ... }, with_advisory_lock { ... }, any method that calls lock! |
| Callbacks that run inside the save transaction | before_save, after_create, around_update, after_destroy, after_touch, before_commit |
| Custom validations | validate :vat_number_is_real, validate { ... } |
| Migrations | change, up and down in an ActiveRecord::Migration, unless it calls disable_ddl_transaction! |
after_commit, after_create_commit, after_rollback and the rest of the commit callbacks run outside the transaction, so txray deliberately leaves them alone. That distinction is the whole point: moving a call from after_create to after_commit is usually the fix.
Two of these are easy to forget. Validations run inside the transaction save opens, so an API call in a custom validator holds the connection exactly like one in before_save (the geocoder gem's own README suggests after_validation :geocode, which is a network call inside your save transaction). And a migration body runs in a DDL transaction, so a data backfill that loops over a large table holds it for the length of the backfill.
What it looks for
| Rule | Severity |
|---|---|
http-in-transaction |
high |
external-service-in-transaction |
high |
mail-in-transaction |
high |
shell-in-transaction |
high |
sleep-in-transaction |
high |
job-enqueue-in-transaction |
medium |
broadcast-in-transaction |
medium |
upload-in-transaction |
medium |
iteration-in-transaction |
medium |
blocking-io-in-transaction |
medium |
cache-in-transaction |
low |
dynamic-dispatch-in-transaction |
low |
bundle exec txray --rules prints the list with the suggested fix for each.
Following the call
The interesting offenders are rarely in the transaction block itself:
class Order < ApplicationRecord
  include Notifiable

  after_create :settle

  def settle
    charge_card
    notify_downstream
  end

  def charge_card
    Stripe::PaymentIntent.create(amount: total_cents)
  end
end
txray resolves after_create :settle to Order#settle, follows charge_card into the same class and notify_downstream into the Notifiable concern in another file, and reports both calls with the path it took to reach them.
It follows bare calls in the same class, self. calls into class methods, Constant.method calls into another class, and Constant.new(...).method into a service object. A transaction that only says Checkout.new(order).call is still traced to the Stripe call three files away. --depth controls how far it follows (three levels by default).
Clients held in variables
Most real client calls never name a risky constant:
class Gateway
  def charge(order)
    ApplicationRecord.transaction { client.post("/charges", order.to_json) }
  end

  def client = @client ||= Faraday.new(url: ENV["API"])
end
Building a client marks the binding rather than reporting it, and a call on a marked binding is the offense. txray tracks clients through local variables, instance variables, constants, memoized reader methods and delegate targets, and reports the request (client.post) rather than the harmless construction. Chained calls like Twilio::REST::Client.new(sid, token).messages.create(...) are reported once, at the outermost call.
Add your own wrappers with external_clients in the config and they are treated the same way.
Metaprogramming
txray resolves what it can and is explicit about what it cannot:
send/public_sendwith a symbol literal is followed like a direct call- methods built with
define_methodare indexed and followed - callbacks registered from a concern's
included doblock resolve, including when the method lives on the host class delegate :charge, to: :gatewayfollows through to the target
When the target genuinely cannot be resolved (send("#{provider}_charge")), txray reports dynamic-dispatch-in-transaction at low severity rather than passing silently, so the blind spot is visible instead of invisible.
What static analysis cannot see: a client passed in as an argument, dispatch through method_missing, and work buried inside a gem. That is what the runtime guard is for.
Configuration
bundle exec txray --init
.txray.yml is discovered by walking up from the working directory, so it keeps working from subdirectories and from an editor integration.
include:
  - app
  - lib
  - db/migrate
exclude:
  - spec
  - test
  - vendor
max_depth: 3
fail_level: low
disabled_rules:
  - cache-in-transaction
severities:
  broadcast-in-transaction: high
external_clients:
  - InternalApi
  - LegacySoapClient
runtime:
  enabled: false
  threshold_ms: 250
  on_violation: log
  log_path: tmp/txray.ndjson
  ignore:
    - LegacyImporter
Exclusions apply to the path below the root being scanned, so vendor means the vendor directory in your project, not any directory named vendor anywhere above it.
Inline suppression
Directives follow the same shape as RuboCop's. A trailing comment silences that line:
def charge = Faraday.post(url) # txray:disable
def charge = Faraday.post(url) # txray:disable http-in-transaction
A comment on its own line opens a region that runs until the matching enable, or to the end of the file if there is none:
# txray:disable http-in-transaction
Faraday.post(url)
Faraday.get(url)
# txray:enable http-in-transaction
Name several rules with commas, and re-enable them independently:
# txray:disable http-in-transaction, job-enqueue-in-transaction
...
# txray:enable job-enqueue-in-transaction
A bare directive, or all, covers every rule. At the top of a file that silences the whole file:
# txray:disable all
Command line
Usage: txray [options] [paths]
       txray watch [options]

    -f, --format FORMAT   text, json, sarif or github (default: text)
    -c, --config PATH     path to a .txray.yml file
        --fail-level      low, medium, high or none (default: low)
        --only RULES      report only these rule ids
        --except RULES    skip these rule ids
        --depth N         how far to follow method calls (default: 3)
        --rules           list every rule and exit
        --init            write a default .txray.yml
        --file PATH       watch: event log written by the runtime guard
        --threshold MS    watch: slow transaction threshold
        --from-start      watch: replay the existing log first
CI
name: txray

on:
  pull_request:
  push:
    branches: [ main ]

jobs:
  transactions:
    runs-on: ubuntu-latest
    steps:
      - uses: actions/checkout@v4
      - uses: ruby/setup-ruby@v1
        with:
          bundler-cache: true
      - name: Scan for slow transactions
        run: bundle exec txray --format github
That one step does three things. It annotates the offending lines inline on the pull request, with the call path and the suggested fix in each annotation. It writes a table of every finding to the job summary, so the run page carries the full list even though GitHub caps how many annotations it will render for a single step. And it exits non zero, so the check fails.
Use --fail-level high to annotate everything but only fail the build on the high severity rules, or --fail-level none to report without ever failing while you work through a backlog.
To send findings to GitHub code scanning instead, so they appear in the Security tab and track across branches:
      - run: bundle exec txray --format sarif > txray.sarif
        continue-on-error: true
      - uses: github/codeql-action/upload-sarif@v3
        with:
          sarif_file: txray.sarif
That job needs permissions: security-events: write. continue-on-error matters: without it a failing scan skips the upload step, and the findings never arrive.
Paths are reported relative to the working directory in every format, which is what GitHub needs to match a finding to a file in the repository.
Runtime guard
Static analysis cannot see through metaprogramming, gem internals or a client handed in as an argument. The optional runtime guard catches what is left, from inside a running application:
runtime:
  enabled: true
  threshold_ms: 250
  on_violation: raise
It reports a transaction that stays open past the threshold, a job enqueued while a transaction is open, mail delivered while a transaction is open, and any Net::HTTP request made while a transaction is open (which covers Faraday, HTTParty, RestClient, Octokit and everything else built on it). Each finding is attributed to the transaction that was open, with the duration of the offending call and the application frame that caused it. on_violation: log warns, raise fails loudly. Run it as raise in test and log in development.
Rails versions
The analyzer has no Rails dependency at all. The runtime guard supports Rails 7.0 through 8.x and picks its hook accordingly. From Rails 7.2 it subscribes to the start_transaction.active_record and transaction.active_record notifications. Rails 7.0 and 7.1 do not emit start_transaction, and the duration carried by transaction.active_record is not the duration of the transaction, so on those versions the guard times within_new_transaction itself. Both paths report the same real duration, attribute findings to the transaction that was open, and record the commit or rollback outcome; both are covered by the test suite and exercised in CI against 7.1, 7.2 and 8.0.
Known-good work can be excused:
Txray::Runtime.ignore do
  LegacyImporter.run!
end
ignore in the config takes patterns matched against the message and source of each finding. Txray::Runtime.uninstall tears the guard back down, which test suites need when they install it per example.
Live monitor
The guard writes newline delimited JSON to runtime.log_path. txray watch tails it and renders what your application is doing right now:
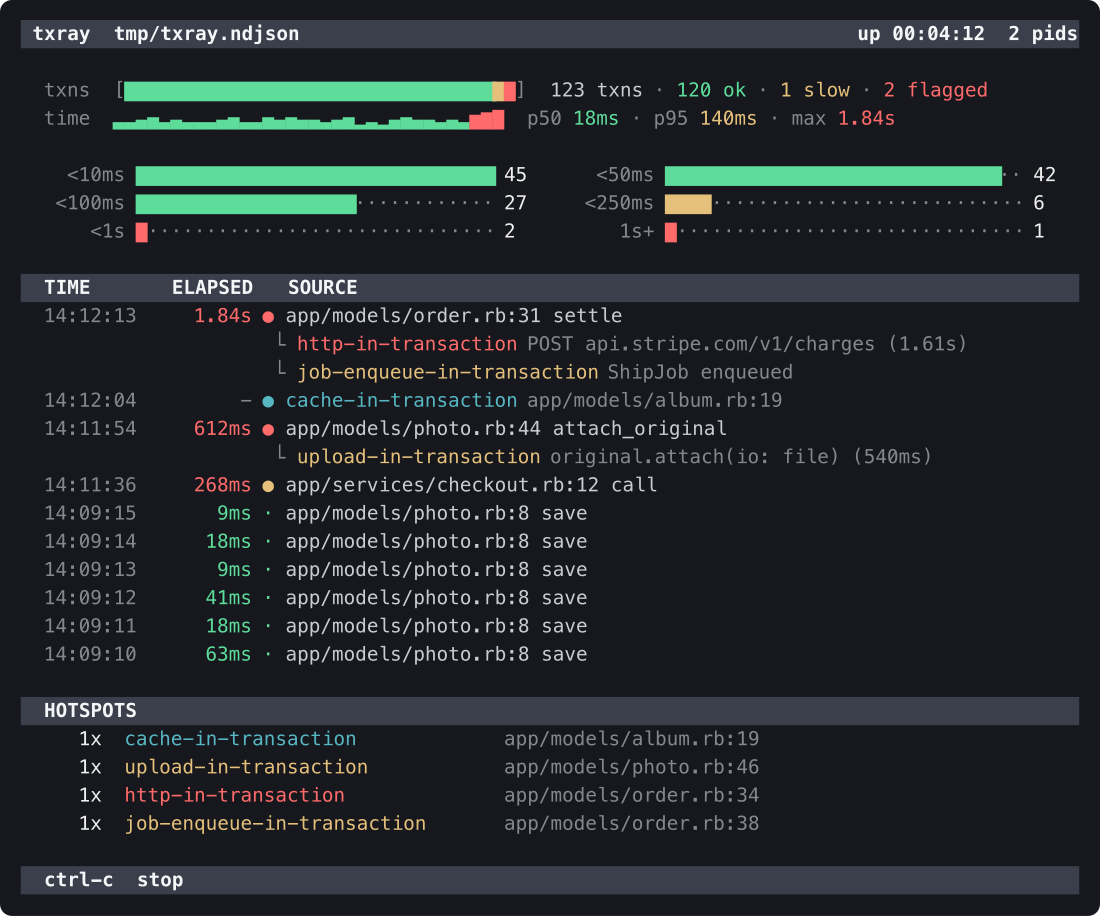
The txns meter is a stacked bar of clean, slow and flagged transactions. The time row is a log scaled sparkline of recent durations next to p50, p95 and max, all coloured against your threshold. Below that is a latency histogram, then the live feed, where findings hang under the transaction that produced them, so you see the 1.84 second transaction and the two calls that account for most of it. Hotspots rank what keeps happening. Everything is coloured by rule severity and clipped to your terminal, down to 60 columns.
Turning it on
Three steps, in this order:
-
Gemfile must not say
require: false(see Install above), or nothing is ever written. -
Enable the guard, in
.txray.yml:runtime: enabled: true threshold_ms: 250or in
config/environments/development.rb:config.txray.enabled = true config.txray.threshold_ms = 250 -
Restart the app, then run the two side by side:
terminal 1:  bin/dev
terminal 2:  bundle exec txray watch
Exercise the app and transactions appear as they close. Only transactions that ran past the threshold or carried a finding are recorded, so the feed stays quiet until something is actually wrong. If the log does not exist yet, txray watch says so and repeats these steps on screen rather than sitting blank.
| Flag | Effect |
|---|---|
--from-start |
replay the existing log instead of only new events |
--threshold 100 |
lower the bar to see more |
--file PATH |
watch a different log |
Ctrl-C prints a summary of the session. Piped to a file or another process it emits the raw event stream instead of the dashboard, so txray watch | jq works.
The log is append only with an exclusive lock per write, so several Puma workers and Sidekiq processes can share one file. It is newline delimited JSON rather than a text log because the watcher reads it incrementally while it is being written: one line is one complete record, so a partial read is never a partial event, concurrent writers cannot interleave into one record, and the nested findings and durations survive without parsing prose. It is still a plain text file, so tail -f tmp/txray.ndjson works.
How this differs from what already exists
isolator detects the same class of problem at runtime, so it only sees code your tests actually execute. txray answers the same question statically: no boot, no database, no coverage requirement, and it works on a cold checkout of a codebase you have never run. Its runtime guard then covers the rest, and adds transaction duration and a live view, which isolator does not do. The two compose well. Nothing in rubocop-rails covers this.
Roadmap
The rule registry is keyed by category so the transaction rules are the first family rather than the only one. Planned: query rules (N+1 shapes in views and loops, count where size would do, unbounded all loads, missing includes), schema rules (unindexed foreign keys and filtered columns), and job rules (Active Record objects passed as job arguments).
Development
bin/setup
bundle exec rake
Releases are cut by tagging; see CONTRIBUTING.md.
License
MIT